

FinanceInvestmentFintechMarket AnalysisAnalytics

Cracking the Code: The Ultimate Beginner's Guide to Equity Research in India
Madhav Tandon
7 min read
October 3, 2025
182 views
Equity Research 101: It's Not Rocket Science
Equity research is basically a company’s tell-all diary, studied to decide whether its stock is a bargain or a bad bet. “Equity” means shares, and research means digging into a company’s financial health, industry, and growth plans. In India’s high-voltage market—where Reliance, Adani, or Infosys can shake the Sensex overnight—analysts act like matchmakers between businesses and investors.
There are two flavors: buy-side (quiet teams at mutual funds like HDFC or SBI, analyzing for their own portfolios) and sell-side (brokerage houses like ICICI or Kotak, publishing bold “BUY” or “SELL” reports for clients). Both keep the ₹400 lakh crore Indian equity market buzzing.


The Investor Superpower You Didn’t Know You Needed
Why does this matter? Because equity research shields you from investing in FOMO and rumours. Analysts break down a company’s story—like revenues from a booming e-commerce push or red flags from piling debt—so investors don’t get blindsided. For big players like LIC, research guides billion-rupee bets; for retail investors, it might be that app notification saying “TCS is undervalued.” In short, it turns raw filings into clear signals.
The Core Toolkit: Financial Statements—Your Company’s Diary Entries
Equity research starts with three basics: the Balance Sheet (what a company owns vs. owes), the Profit & Loss Statement (sales minus costs = profit), and the Cash Flow Statement (shows real cash in/out). Each gives unique insights—profits may look good, but poor cash flow can reveal hidden trouble. Indian listed companies must publish these every quarter—free treasure for investors willing to look.

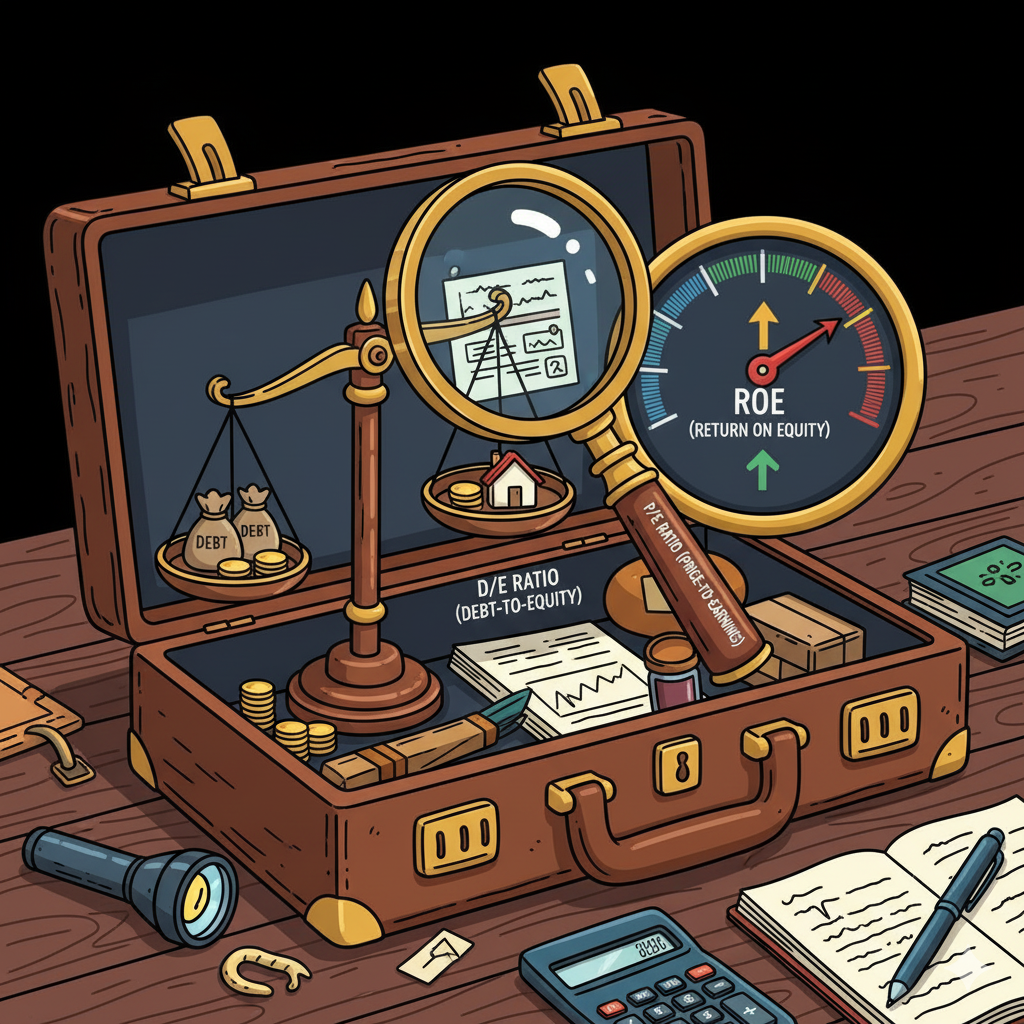
Ratio Roundup: Quick-Scan Secrets to Spotting Winners
Too many numbers? Ratios simplifies
P/E (Price-to-Earnings) tells you if a stock is pricey or cheap.
ROE (Return on Equity) shows how well the company uses shareholder money.
D/E (Debt-to-Equity) reveals if it’s borrowing too much.
Together, they give you a quick X-ray of a company’s health.
Real Talk Example: RIL Under the Lens
Reliance Industries (RIL) is India’s giant, spanning telecom, retail, and energy. In FY25, it posted ₹10.7 lakh crore in revenue and over ₹81,000 crore profit, with a low D/E ratio of 0.37—solid finances. Its P/E of ~23 makes it fairly priced for such a diversified juggernaut. Analysts call it a long-term player, though oil price swings are a risk. This is how statements + ratios come together in real-world equity research.

Inside the Report: From Data Dump to Decision Dynamo
An equity research report is structured storytelling: company background, industry outlook, financials, valuation, and the all-important call—BUY, HOLD, or SELL. Sell-side reports add flashy charts, while buy-side reports are internal strategy tools. Both help investors cut through noise and act with confidence.
The Analyst’s Secret Sauce: Skills Beyond Spreadsheets
Equity research blends technical skills with communication. Analysts need to master Excel and valuation models, but also craft clear narratives. They’re detectives during earnings calls, economists spotting sector trends, and storytellers explaining why a stock makes sense. For students, it’s a launchpad for careers in investment banking, consulting, or personal investing.


Level Up: Your Gateway to Market Mastery Awaits
And that’s it—you’ve just unlocked the secret language of equity research! From “what it is” to “why it matters,” you now know what analysts do when they disappear behind their spreadsheets. Now you’re officially smarter than the friend who only invests because “Bhaiya ne bola tha.”
Next up in Part 2: we dive into IPO mania—yes, the hype, the headlines, and the heartbreaks (looking at you, Paytm ). Buckle up, because your journey from curious reader to sharp market thinker has only just begun.
Madhav Tandon


